A very short note how to integrate Superset with Victoria Metrics.

Superset it’s gaining popularity among users especially Business/Product Owners and people who would like to create Business Intelligence graphs. Unfortunately it does not support Prometheus protocol at the moment of writing, therefore can not be used for DevOps’ish or Telemetry BI. This can resolved with very popular in Data Scientists circles data aggregation framework— Trino. It allows to gather and transform data from different sources. Let’s see how it can help us extract data from VM and pass it into Superset for plotting and visualisation.
To start we need a few things ready:
Kubernetes. I use OpenShift, therefore be mindful that some kinds might be different (for example route is equivalent of Ingress in vanila kube)
Superset. Deployed via Helm Chart or can be deployed from Kustomize (be aware of version as Kustomize built from Helm template)
Trino (aka Starburst). Installed OpenShift Starburst Operator or Helm Operator. This is an enterprise version of Trino, I assume that Enterprise version is more stable than community (1.3k open issues on github at the moment of this writing). It shipped with a few free connectors and one of them is Prometheus. Default CRD is hungry for resources (100GB memory for workers) so I updated resource requests in my manifests to make it run on smaller cluster (for demo purposes).
Victoria Metrics. Installed OpenShift operator.
Assuming that Kubernetes is up and running, operators installed (and Superset had been deployed ) in vm namespace, apply Kustomize manifest
oc apply -k https://github.com/mancubus77/superset-trino-vm.git/base
As result Victoria Metrics cluster and Trino/Starburst will be deployed in vm namespace.
NB. Ingress for services not included for non OpenShift k8s, please expose services yourself.
NB2. Sunburst (v.356) has a bug, what doesn’t work with Prometheus endpoints that have URI (eg: https://prometheus/select/0/prometheus). Therefore you need to use Ingress + Rewrite rule to address it. Update your Victoria Metrics endpoint here.
To play with Trino we might need a cli tool what can be installed from your favourite packet manager, I use brew , therefore for MacOS owners it’s brew install trino
Connect to Startburst coordinator via trino CLI (expose service via ingress if it’s not OpenShift)
./trino — server=coordinator-vm.apps.ocp4.rhpg.org:80
Now you can run Trino/Presto SQL to extract data from Victoria Metrics:
# Show al
trino> SHOW SCHEMAS from Prometheus;
       Schema
--------------------
 default
 information_schema
(2 rows)Query 20210920_125344_00004_xqx8m, FINISHED, 3 nodes
Splits: 36 total, 36 done (100.00%)
0.28 [2 rows, 35B] [7 rows/s, 123B/s]# Show all tables in default schema
trino> SHOW TABLES FROM prometheus.default;
                                        Table
-------------------------------------------------------------------------------------
 :kube_pod_info_node_count:
 :node_memory_memavailable_bytes:sum
 aggregator_openapi_v2_regeneration_count
 aggregator_openapi_v2_regeneration_duration
 aggregator_unavailable_apiservice
 alertmanager_alerts
 alertmanager_alerts_invalid_total
 alertmanager_alerts_received_total
 node_load15# Prepare SQL for explanation
trino> PREPARE my_select1 FROM SELECT * FROM prometheus.default.node_load15;# All tables
trino> DESCRIBE OUTPUT my_select1;
 Column Name |  Catalog   | Schema  |    Table    |            Type             | Type Size | Aliased
-------------+------------+---------+-------------+-----------------------------+-----------+---------
 labels      | prometheus | default | node_load15 | map(varchar, varchar)       |         0 | false
 timestamp   | prometheus | default | node_load15 | timestamp(3) with time zone |         8 | false
 value       | prometheus | default | node_load15 | double                      |         8 | false
(3 rows)Query 20210920_125727_00011_xqx8m, FINISHED, 1 node
Splits: 1 total, 1 done (100.00%)
0.78 [0 rows, 0B] [0 rows/s, 0B/s]# Select all entries from table
trino> SELECT timestamp, value, map_keys(labels) as insance  FROM prometheus.default.node_load15 where  element_at(labels, 'pod') = 'node-exporter-nnd4s';
          timestamp          | value |                                                 insance
-----------------------------+-------+-------------------------------------------------------------------------------------------------------
 2021-09-18 13:13:48.412 UTC | 22.74 | [__name__, namespace, service, job, instance, pod, container, endpoint, prometheus, prometheus_replica
 2021-09-18 13:14:03.393 UTC | 22.75 | [__name__, namespace, service, job, instance, pod, container, endpoint, prometheus, prometheus_replica
 2021-09-18 13:14:18.395 UTC | 23.03 | [__name__, namespace, service, job, instance, pod, container, endpoint, prometheus, prometheus_replica
 2021-09-18 13:14:33.394 UTC | 23.23 | [__name__, namespace, service, job, instance, pod, container, endpoint, prometheus, prometheus_replica
 2021-09-18 13:14:48.395 UTC | 23.24 | [__name__, namespace, service, job, instance, pod, container, endpoint, prometheus, prometheus_replica
 2021-09-18 13:15:03.390 UTC | 23.37 | [__name__, namespace, service, job, instance, pod, container, endpoint, prometheus, prometheus_replica# run aggregation functions
trino> SELECT sum(value) FROM prometheus.default.node_load15 where  element_at(labels, 'pod') = 'node-exporter-nnd4s';
       _col0
-------------------
 433328.5800000004
(1 row)
As it works, it’s time to integrate with Superset
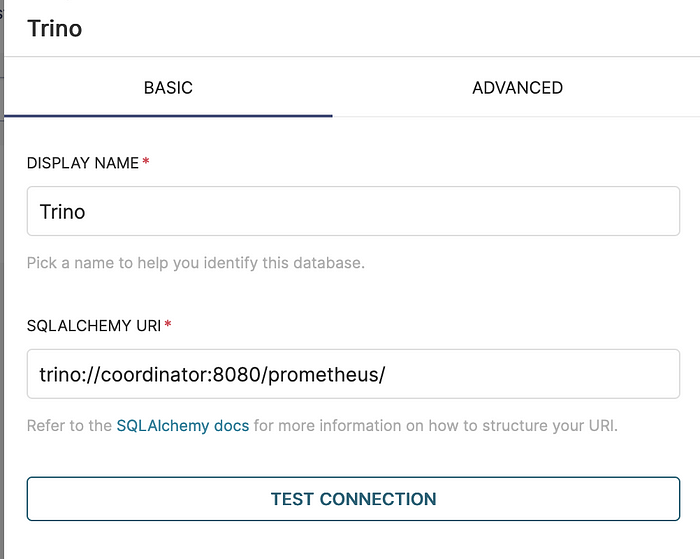
Create new database:

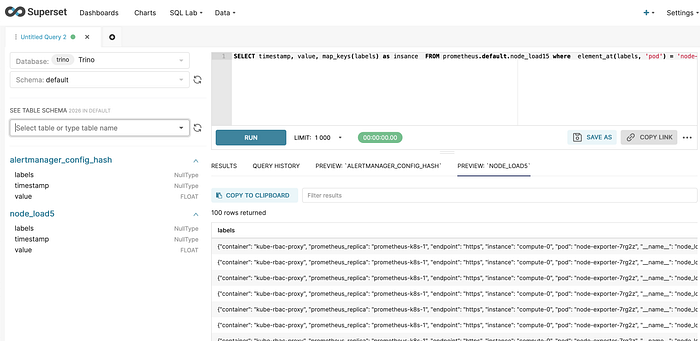
Run test SQL via new Trino Database connection:

When data extracted, build a nice graphs

Conclusion
Starburst/Trino is data scientist tool, but can be used to extract metrics from different sources for Superset BI. It’s written in Java, so if you thinking to use it in production, check sizing recommendations.
